Kubernetes and Cloud Native Associate (KCNA)
Overview
The KCNA exam is considered to be the entry level exam. It is a multiple choice exam that tests your overall understanding of fundamental Kubernetes and Cloud Native architecture concepts.
Read through the Kubernetes and Cloud Native Associate (KCNA) page for Domain and Competency details and information on how to register for the exam.
Some of the topics that you should be familiar with include:
- Container fundamentals
- Kubernetes fundamentals
- Cloud Native architecture
- Cloud Native observability tools
- Cloud Native application delivery tools
Let's practice with some exercises to help familiarize yourself with the concepts.
Container fundamentals
A container is an application packaging method that allows you to run an application and its dependencies in an isolated environment. Containers are lightweight and portable, making them ideal for deploying applications in a cloud native environment.
A container image is defined within a Dockerfile. The Dockerfile contains instructions on how to build the image. The image is then used to create a container.
Warning
This section will require you to work in your local machine (not in the virtual machine) and have Docker and Node.js installed on your local machine.
If you don't have Docker installed, follow the instructions on the Docker installation page to install Docker.
If you don't have Node.js installed, follow the instructions on the Node.js installation page to install Node.js.
Create a simple Node.js application
Let's create a simple Node.js application and package it in a container. Open a terminal and follow the steps below:
On your local machine, create a new directory for the application:
mkdir myapp
cd myapp
Initialize a new Node.js application.
npm init -y
Install the express package.
npm install express
Create a new directory called src. This is where application source code will live.
mkdir src
cd src
Create a file called server.js and add the following code.
const express = require("express");
const app = express();
const server = app.listen(3000, () => {
  console.log(`Express running → PORT ${server.address().port}`);
});
app.get("/", (req, res) => {
  res.send("Hello World!");
});
Return to the myapp directory and run the application.
cd ..
node src/server.js
Open a browser and navigate to http://localhost:3000. You should see "Hello World!" displayed.
Press Ctrl+C to stop the application.
Package the application in a container
Now that we have a simple Node.js application, let's package it in a container. We will use Docker to build the container image.
Create a new file called Dockerfile in the myapp directory and add the following code.
FROM node:22
WORKDIR /usr/src/app
COPY package*.json ./
RUN npm install
EXPOSE 3000
COPY . .
CMD ["node", "src/server.js"]
Build the container image.
docker build -t myapp:latest .
Run the application in a container.
docker run -d -p 3000:3000 myapp:latest
Open a browser and navigate to http://localhost:3000. You should see "Hello World!" displayed.
Run the following command to list the running containers.
docker ps
docker stop <CONTAINER_ID> # replace <CONTAINER_ID> with the actual container ID
Tip
You don't need to pass in the entire container ID. You can just pass in the first few characters of the container ID.
Multi-stage builds
The Dockerfile above is fairly simple, but it can be optimized using multi-stage builds. Multi-stage builds allow you to use multiple FROM statements in a single Dockerfile. This can help reduce the size of the final image and is often used as a best practice in terms of security and performance.
Reference: https://docs.docker.com/get-started/docker-concepts/building-images/multi-stage-builds/
Run the following command to list the container images.
docker images
Note the size of the myapp:latest image is a little over 1.6GB. It is quite large because it contains all the dependencies and build artifacts.
Open the Dockerfile and replace the contents with the following code.
# Build stage
FROM node:22 AS build
WORKDIR /usr/src/app
COPY package*.json ./
RUN npm install
COPY . .

# Production stage
FROM node:22-slim
WORKDIR /usr/src/app
COPY --from=build /usr/src/app .
EXPOSE 3000
CMD ["node", "src/server.js"]
This Dockerfile has two stages: a build stage and a production stage. The build stage is used to install dependencies and build the application, while the production stage is used to run the application using a "slim" version of the Node.js image. This often results in a smaller final image size and reduces the attack surface.
Build the container image again.
docker build -t myapp:latest .
List the container images again.
docker images
The size of the myapp:latest image is now a little over 340MB. This is a significant reduction in size. Not only that, but the final image only contains the files needed to run the application, which is a good security practice.
If you build and run the container image using the same commands as before, you should see the same "Hello World!" message displayed.
Multi-architecture builds
The promise of containers is that they can run anywhere. But in reality, this isn't always the case. Different operating system architectures require different container images. For example, a container image built for AMD64 architecture won't run on ARM64 architecture.
Good news is that Docker gives you the ability to build container images for different architectures. The docker CLI includes a plugin feature called buildx that allows you to build multi-arch images. This allows you to run the same container image on different platforms without modification.
You can create a new buildx builder by running the following command.
docker buildx create --name mybuilder --driver docker-container --platform linux/amd64,linux/arm64,linux/arm64/v8 --bootstrap --use --node mybuilder
Note
You can also configure Builders in your Docker Desktop settings.
Reference: https://docs.docker.com/buildx/working-with-buildx/
Now you can use the new buildx builder to create a multi-arch image.
docker buildx build --platform linux/amd64,linux/arm64 --output type=image,push=false -t myapp:latest .
In the build output you should see that the image is built for both AMD64 and ARM64 architectures.
Container registries
Container images can be stored in container registries, such as Docker Hub, a private Azure Container Registry, or GitHub Container Registry. This allows you to share images with others and deploy them to different environments.
There are many guides available on how to push and pull images from different container registries. But for this exercise, we'll use ttl.sh which is an ephemeral and anonymous container registry offered by friends at Replicated.
Container images pushed to ttl.sh have a limited lifetime and are automatically deleted after a specified period. So, you need to to give the image a unique repository name and give it a lifetime in the form of a tag. The tag is a string that represents the lifetime of the image. For example, 4h means the image will be deleted after 4 hours.
Run the following commands to create a unique repository name and tag.
IMG_REPO=$(uuidgen | tr '[:upper:]' '[:lower:]')
IMG_VERSION=4h
Build and push the container image to ttl.sh.
docker buildx build --platform linux/amd64,linux/arm64 --push -t ttl.sh/${IMG_REPO}:${IMG_VERSION} .
Now if you run the following command, you should see the image hosted ttl.sh supports both AMD64 and ARM64 architectures.
docker buildx imagetools inspect ttl.sh/${IMG_REPO}:${IMG_VERSION}
Run the following command to print the container image you pushed to ttl.sh and copy the output of the command to a text file for future reference.
echo ttl.sh/${IMG_REPO}:${IMG_VERSION}
Note
Remember this container image will be deleted after 4 hours.
Kubernetes fundamentals
Now that you have a basic understanding of containers, let's move on to Kubernetes. Kubernetes is an open-source container orchestration platform that automates the deployment, scaling, and management of containerized applications.
Architecture and components
Quickly review the Kubernetes Architecture documentation to understand the key components of a Kubernetes cluster. It is a great way to get started with Kubernetes and will help you understand the basic concepts.
The cluster is made up of a control plane and one or more worker nodes. The control plane is responsible for managing the cluster and the worker nodes are responsible for running the applications.
Note
You created a control plane node and joined worker nodes to the cluster using the kubeadm tool in the previous section.
Be sure to read through the control plane components and node components sections of the Kubernetes docs to understand the roles of each component.
Kubernetes has a rich and extensive ecosystem that typically requires dedicated time to master fully. In this workshop, we'll focus on practical fundamentals by deploying our Node.js application to a Kubernetes cluster, giving you hands-on experience with key concepts that matter most for the KCNA exam.
Create a Namespace
Namespaces are a way to logically separate resources in a cluster. They are intended for use in environments with many users spread across multiple teams, or projects.
Create a Namespace called myapp to isolate the resources for our Node.js application by running the following command.
kubectl create namespace n345
Tip
You will use kubectl to perform imperative commands to deploy the application. This is good to quickly perform a task, but using declarative configuration files in the form of YAML manifests is the best way to deploy applications in production. You will visit this more in the next few sections.
Run a container in a Pod
Containers don't run on their own in Kubernetes. They run inside a Pod. A Pod is the smallest deployable unit in Kubernetes and represents a single instance of a running process in your cluster. To run a Pod, the easiest way is to use kubectl, which is the Kubernetes command-line tool that allows you to interact with your cluster and use an imperative command to create a Pod.
SSH back into the control node and run the following command to create a Pod that runs the Node.js application.
kubectl run myapp \
--namespace n345 \
--image=<PASTE_IN_YOUR_CONTAINER_IMAGE_NAME> \
--port=3000
Warning
Make sure you are connected to your virtual machine using SSH.
Run the following command to list the Pods in your cluster.
kubectl get pods --namespace n345
Expose the Pod with a Service
The Pod is running, but it isn't accessible from outside the cluster. To make it accessible, you need to expose the Pod as a Service. A Service in Kubernetes is an abstraction that defines a logical set of Pods and a policy by which to access them.
Run the following command to expose the Pod as a Service.
kubectl expose pod myapp \
--namespace n345 \
--type=NodePort \
--port=80 \
--target-port=3000
Note
Notice that we're using the --type=NodePort flag to expose the Pod as a NodePort Service. This means that the Service will be exposed on a port on each Node in the cluster. There are other types of Services, such as ClusterIP and LoadBalancer, and you should read the Kubernetes documentation to learn more about them.
Run the following command to list the Services in your cluster.
kubectl get services --namespace n345
You will see output similar to the following:
NAME    TYPE       CLUSTER-IP       EXTERNAL-IP   PORT(S)        AGE
myapp   NodePort   10.107.207.155   <none>        80:31519/TCP   4s
The myapp Service is now exposed on port 31519 on your virtual machine. You can access the Node.js application by navigating to http://control:31519 in your browser.
Warning
Your Service port might be different than 31519, so make sure to check the output of the kubectl get services command and adjust the URL accordingly. This also assumes you added the control node IP address to your /etc/hosts file in the previous section.
You could also generate the URL by running the following command.
echo "http://$(kubectl get nodes -o jsonpath='{.items[0].status.addresses[0].address}'):$(kubectl get services myapp -n n345 -o jsonpath='{.spec.ports[0].nodePort}')"
Click the URL in the terminal to access the Node.js application.
Scale the application with Deployments and ReplicaSets
Running a single Pod is fine for testing, but in a production environment, you would want to run multiple instances of your application for redundancy and load balancing. In order to do this, you should deploy the application using a Deployment. A Deployment manages a ReplicaSet, which in turn manages the Pods.
When working with Deployments, you can scale the application by increasing the number of replicas.
Let's create a Deployment that manages the Pods and scale the application to three replicas.
Run the following command to delete the Pod and Service you created earlier.
kubectl delete pod myapp --namespace n345 --wait=false
kubectl delete service myapp --namespace n345 --wait=false
Run the following command to create a Deployment that manages the Pods.
kubectl create deployment myapp \
--namespace n345 \
--image=<PASTE_IN_YOUR_CONTAINER_IMAGE_NAME> \
--replicas=3 \
--port=3000
Run the following command to list the Deployments in your cluster.
kubectl get deployments --namespace n345
Run the following command to list the ReplicaSets in your cluster.
kubectl describe replicasets --namespace n345
Now if you check the Pods, you should see three Pods running.
kubectl get pods --namespace n345
Did you notice that the Pods have different names? Kubernetes automatically generates a unique name for each replica.
Exposing web applications with Ingress
While Services provide basic network access to Pods, Ingress offers a more sophisticated way to expose HTTP/HTTPS applications by providing routing based on hostnames and paths.
Ingress works through two components:
- Ingress resource: The API object that defines routing rules
- Ingress Controller: The implementation that enforces these rules (you installed Ingress-Nginx Controller earlier)
Let's expose our application using Ingress.
# First create a Service for our deployment
kubectl expose deployment myapp \
--namespace n345 \
--port=80 \
--target-port=3000

# Then create an Ingress resource pointing to that Service
kubectl create ingress myapp \
--namespace n345 \
--class=nginx \
--rule="myapp.example.com/*=myapp:80"
Now you can access the Node.js application from your local machine using the following curl command.
curl http://control -H 'Host: myapp.example.com'
Warning
Run this command from your local machine, not the virtual machine.
Cloud Native architecture
Cloud Native architecture is a design philosophy that leverages cloud computing principles to build and run scalable applications in modern environments. It's a set of practices that help organizations deliver applications faster and more reliably.
Twelve-factor app
It will be good to understand some of the key concepts of the Twelve-factor app and how they apply to Cloud Native architecture.
Microservices
One important element of the Twelve-factor app architecture is treating applications as a set of loosely coupled services. This is also known as the microservices architecture. Microservices are small, independent services that work together to form a larger application. They communicate with each other over a network, typically using HTTP or messaging protocols. With microservices, you can break down complex applications into smaller, more manageable components. This allows you to develop, deploy, and scale each component independently.
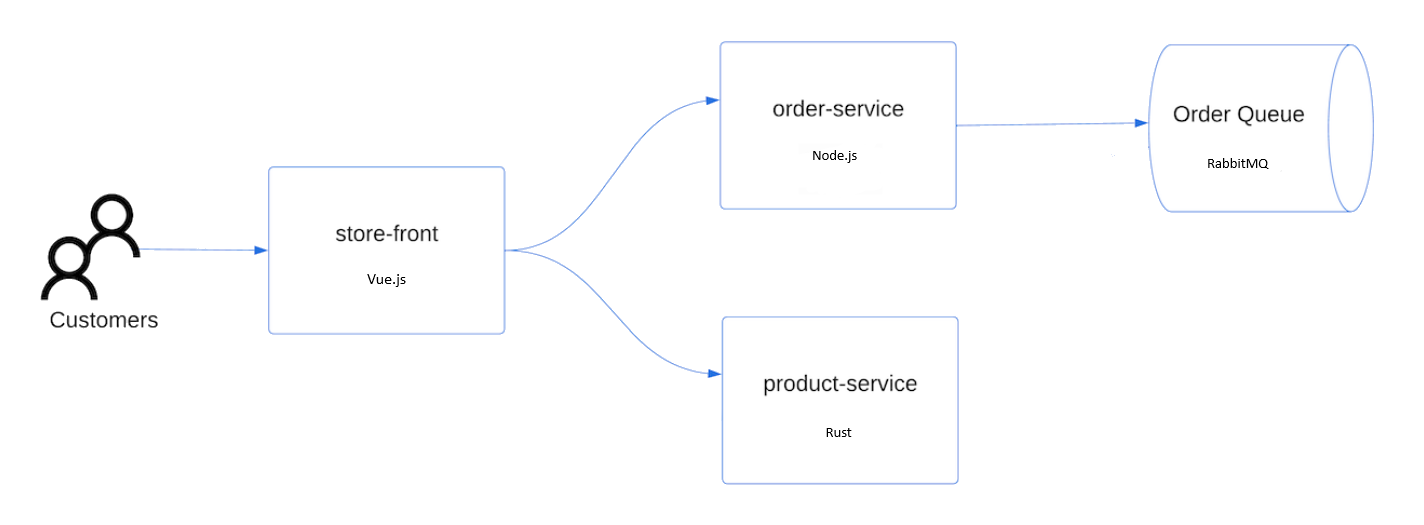
This architectural approach is demonstrated in the AKS Store Demo app.
Run the following command to deploy this sample application to your Kubernetes cluster.
kubectl create ns pets
kubectl apply -n pets -f https://gist.githubusercontent.com/pauldotyu/bfa405733af19bc80c357d6aab5847c7/raw/3f0dd08fcc7a0fb1662369efd0ab47c8b4d0d533/aks-store-demo.yaml
Run the following command to list the Pods in the pets namespace.
kubectl get pods -n pets
The application is made up of multiple microservices. There is a store-front web app written using NodeJS that is the main user interface for a customer. Products are retrieved using a REST API provided by the product-service which is written in Rust. Orders are processed via the order-service, a REST API built with ExpressJS that sends order messages to RabbitMQ (a commonly used message broker). So each of these components is written in different languages and are deployed as separate microservices but connected together via APIs to form a complete application.
Access the application by navigating to the Ingress IP address in your browser. Run the following command to get the URL based on the IP address of Ingress in the pets namespace.
echo "http://$(kubectl get ingress -n pets store-front -o jsonpath='{.status.loadBalancer.ingress[0].ip}')"
Cloud Native observability tools
Observability is the ability to understand the internal state of a system by examining the outputs of its components. In a Cloud Native environment, where applications are distributed and run across multiple containers, it's essential to have tools that provide visibility into the system.
The Three Pillars of Observability
Modern observability is built on three foundational pillars:
- Metrics: Numerical data measured over time (e.g., CPU usage, request count)
- Logs: Text records of discrete events that happened in the system
- Traces: Records of requests as they flow through distributed systems
Understanding these pillars and how they complement each other is crucial for monitoring complex Cloud Native applications.
Key Observability Tools
Metrics Collection and Visualization
Prometheus: An open-source time-series database that collects metrics from monitored targets using a pull model. Prometheus features a powerful query language (PromQL) and is the de facto standard for Kubernetes monitoring.
Grafana: A visualization platform that connects to various data sources including Prometheus. Grafana allows you to create customizable dashboards with alerts and notifications.
Many Kubernetes environments use the kube-prometheus-stack Helm chart to deploy a pre-configured observability solution including Prometheus, Grafana, and Alertmanager.
Distributed Tracing
Jaeger: A distributed tracing system inspired by Google's Dapper paper. Jaeger helps track requests across microservices and visualize service dependencies.
OpenTelemetry: A CNCF project that provides a unified set of APIs and libraries for collecting telemetry data including traces, metrics, and logs.
Log Collection and Analysis
Fluentd: A CNCF graduated project that collects, processes, and forwards logs to multiple destinations.
Elasticsearch, Logstash, and Kibana (ELK Stack): A popular stack for log collection, processing, storage, and visualization.
Practical Application
For the KCNA exam, understanding the high-level concepts of these tools and how they contribute to observability in Cloud Native environments is important. By understanding the capabilities and use cases of these tools, you'll be better prepared for the observability section of the KCNA exam but you won't be expected to know the specifics of each tool.
Cloud Native application delivery tools
Application delivery is the process of getting software into the hands of users in a safe and reliable way. In a Cloud Native environment, this encompasses everything from building and packaging applications to deploying and operating them continuously.
Continuous Integration and Continuous Delivery (CI/CD)
CI/CD forms the foundation of modern application delivery, automating the build, test, and deployment processes. In Cloud Native environments, CI/CD pipelines typically involve:
- Continuous Integration: Automatically building and testing code changes
- Continuous Delivery: Automatically deploying application changes to staging environments
- Continuous Deployment: Automatically deploying to production environments
Reference: https://www.geeksforgeeks.org/what-is-ci-cd/
Key Application Delivery Tools
Package Management and Deployment
Helm: The de facto package manager for Kubernetes. Helm Charts package Kubernetes resources into reusable, versioned templates that can be easily shared and deployed. Helm simplifies complex deployments through:
- Template-based resource generation
- Release management with upgrade and rollback capabilities
- Chart repositories for sharing applications
Kustomize: Native Kubernetes configuration customization. Unlike Helm, Kustomize doesn't use templates but overlays changes on existing YAML files through:
- Base and overlay configurations
- Resource patching without modifying original files
- Environment-specific customizations
GitOps Tools
GitOps is an operational framework that uses Git as the single source of truth for declarative infrastructure and applications:
ArgoCD: A declarative GitOps continuous delivery tool that:
- Automatically synchronizes the desired state from Git to Kubernetes
- Provides visualization for application state and health
- Supports multi-cluster deployments and SSO integration
Flux: A set of continuous delivery solutions for Kubernetes that:
- Ensures cluster state matches Git repository configurations
- Provides automatic image updates based on policies
- Offers multi-tenancy capabilities with Flux's Kustomize controller
Build Tools
Buildpacks: A CNCF project that transforms application source code into container images by:
- Detecting the language/framework of your app automatically
- Adding appropriate runtime dependencies
- Creating optimized OCI-compliant images without requiring Dockerfiles
Kaniko: A tool for building container images inside Kubernetes or CI environments:
- Builds images without requiring privileged Docker daemon access
- Creates images layer-by-layer, caching layers when possible
- Supports cross-architecture builds
Progressive Delivery
Progressive delivery extends continuous delivery with controlled rollouts:
Flagger: A progressive delivery operator for Kubernetes that:
- Automates canary releases, A/B testing, and blue/green deployments
- Integrates with service meshes like Istio, Linkerd, and AWS App Mesh
- Provides automated rollbacks based on metrics
Argo Rollouts: A Kubernetes controller for progressive delivery with:
- Advanced deployment strategies beyond basic Kubernetes deployments
- Traffic shaping capabilities through integration with service meshes
- Analysis capabilities to automate promotion or rollback
For the KCNA exam, understanding how these tools fit into the Cloud Native ecosystem is important. In practice, organizations typically combine multiple tools:
- A CI system like GitHub Actions or Jenkins builds container images
- Artifacts are stored in a container registry
- Helm or Kustomize packages Kubernetes manifests
- ArgoCD or Flux applies these manifests to the cluster
- Progressive delivery tools control how new versions roll out
Many organizations follow the GitOps model where Git repositories contain:
- Application source code
- Container build definitions
- Kubernetes manifests (often managed by Helm or Kustomize)
- Environment-specific configurations
By understanding these tools and workflows, you'll be better prepared for the application delivery section of the KCNA exam and gain insights into how modern Cloud Native applications are delivered to production environments.
Additional resources
- KCNA Exam Curriculum
- KCNA resources for more resources.
- KCNA Certification Learning Path